Field twin—winter wheat, Linköping
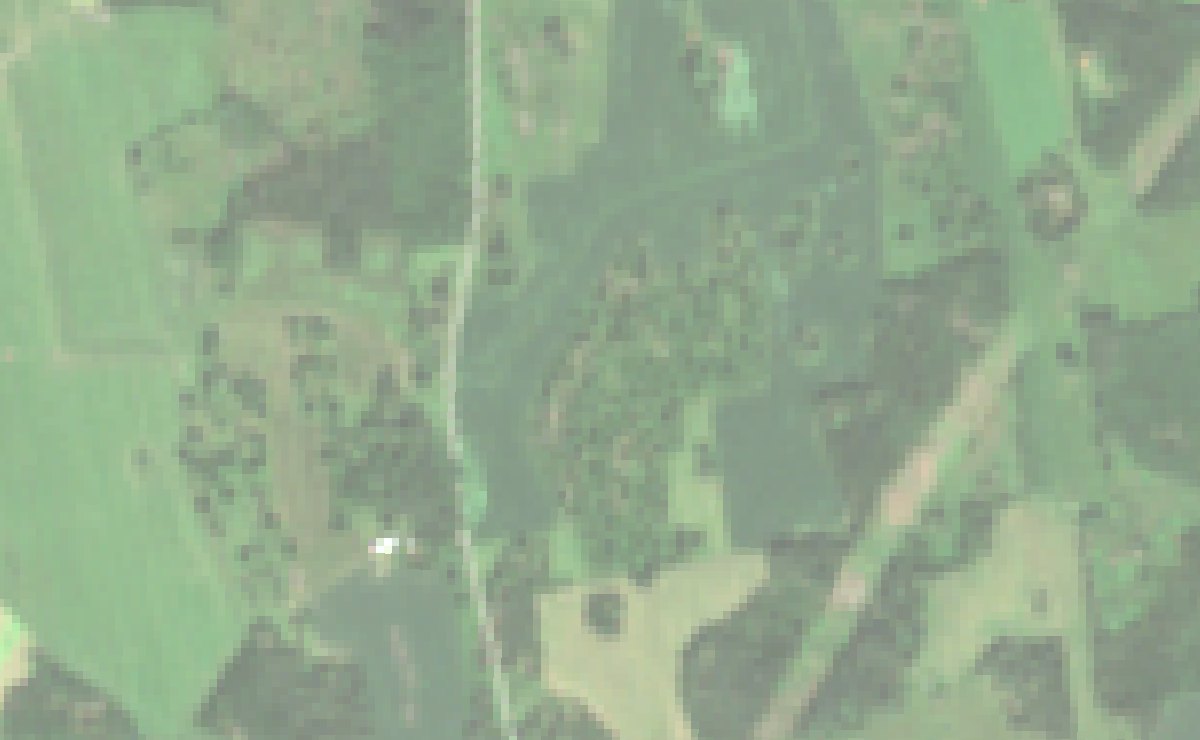
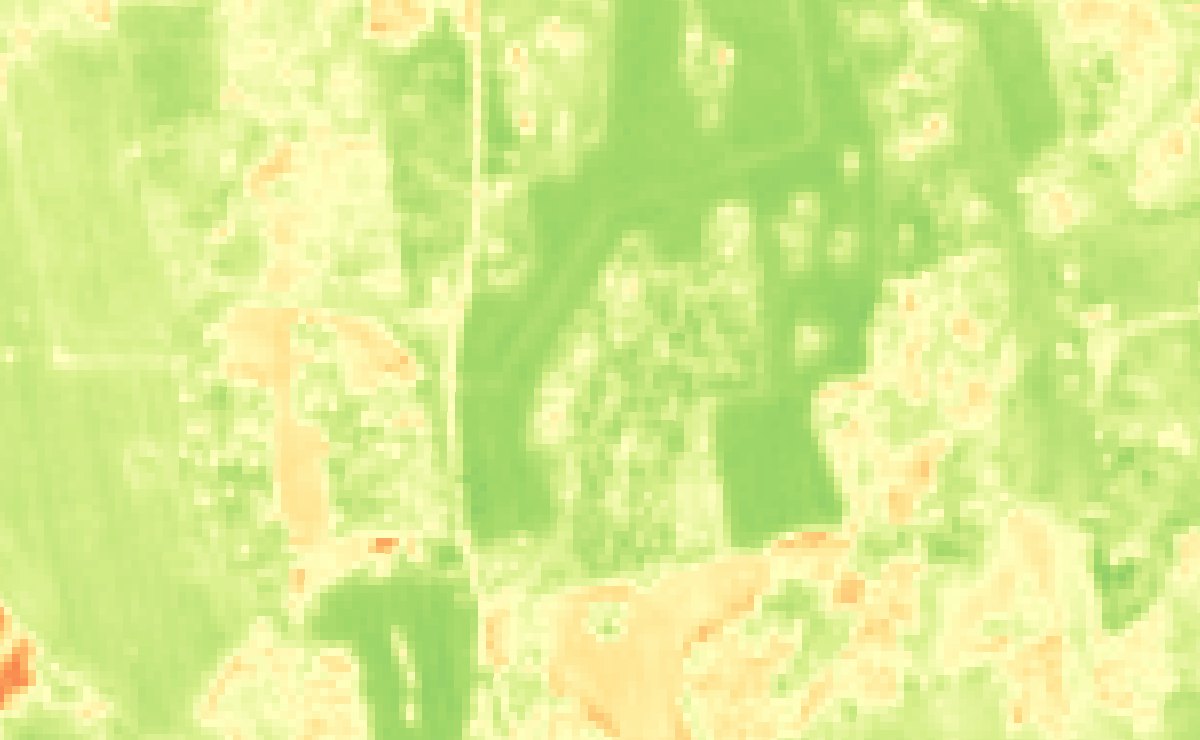
The outlined field is the twin. Photo is what you would see; greenness is what the model is compared against. Press replay to watch last season pass over the field while the chart below draws the same days—pause any time to read, ← → step frame by frame.
Last season, replayed—the twin against the satellite, and the model alone
Why they disagree
The sync—what the satellite changed, and what the twin decides
Model alone vs twin, today
After every clear pass the twin pulls its leaf area toward what the satellite implies, over two days, by a Kalman gain: far when the pass is informative, little near bare soil or a saturated canopy. The model alone never sees the satellite; the twin restarts its forecast from the field as it is.
Decisions, updated daily
Ranges span the five weather years the forecast runs on; before the crop has emerged they are climatology. Grain is taken as 0.45 of the above-ground dry matter the model computes, quoted at 14 % moisture. The alert fires when a pass lands more than 2.5 standard deviations from what the twin expected the day before.
Projections, re-issued every day
Every day the twin re-issues its expected flowering date, harvest-ready date and yield. Bands span the five weather years, the line is the median. They should settle as the season delivers its weather and its passes; a jump is the satellite changing the model's mind.
The crop year—the twin so far, forecast ahead
Details
Weather feeding the model
The crop's clock
Plants count warmth, not days. Flowering starts at the dashed line.
Satellite passes this season
| Date | Day | Satellite | Model | Gap | Sun | Trusted |
|---|
Past seasons—how well the model did
| Season | Crop emerged | Error (NDVI) | Peak leaf area | Grain yield |
|---|